Are we watching the same movie? Diverging tastes among Rotten Tomatoes reviews
You say tomato, I say tomato?
How movie rating differences between elite film critcs and average viewers are increasing over time and cutting into studios’ bottom line.
Hillbilly Elegy is a highly readable, personal memoir detailing author J.D. Vance’s journey from/through a Appalachian (broken) community on to Yale Law School. The book was initially held in wide esteem, particularly among The Atlantic devotees, for providing a glimpse into the often inscrutable (to outsiders) class of voters who helped to elect Donald Trump. In response to the book’s appeal and commercial success (New York Times Best Seller List 2016-2017), director Ron Howard partnered with Netflix to adapt J.D.’s story for a full length motion picture. Given the source material, the choice of director, the talents of Amy Adams and Glenn Close, and a musical score by Hans Zimmer, the film appeared poised for future success.
It was not to be. Well, defining success for which kind of audience is a matter of keen interest, and Rotten Tomatoes helps us get at measurement questions.
Rotten Tomatoes (RT hereafter) is review-aggregation website where users can rate and review both movies and television shows. RT reviewers fall into two camps: critics and (general) audience. “Critics” typically belong to: writing guilds, film critic associations, and/or major newspapers whereas “Audience” reviews come from any/all RT users with an RT account.
RT’s reviews of Hillbilly Elegy are decidedly polarized: critics panned the same film general audience members loved:
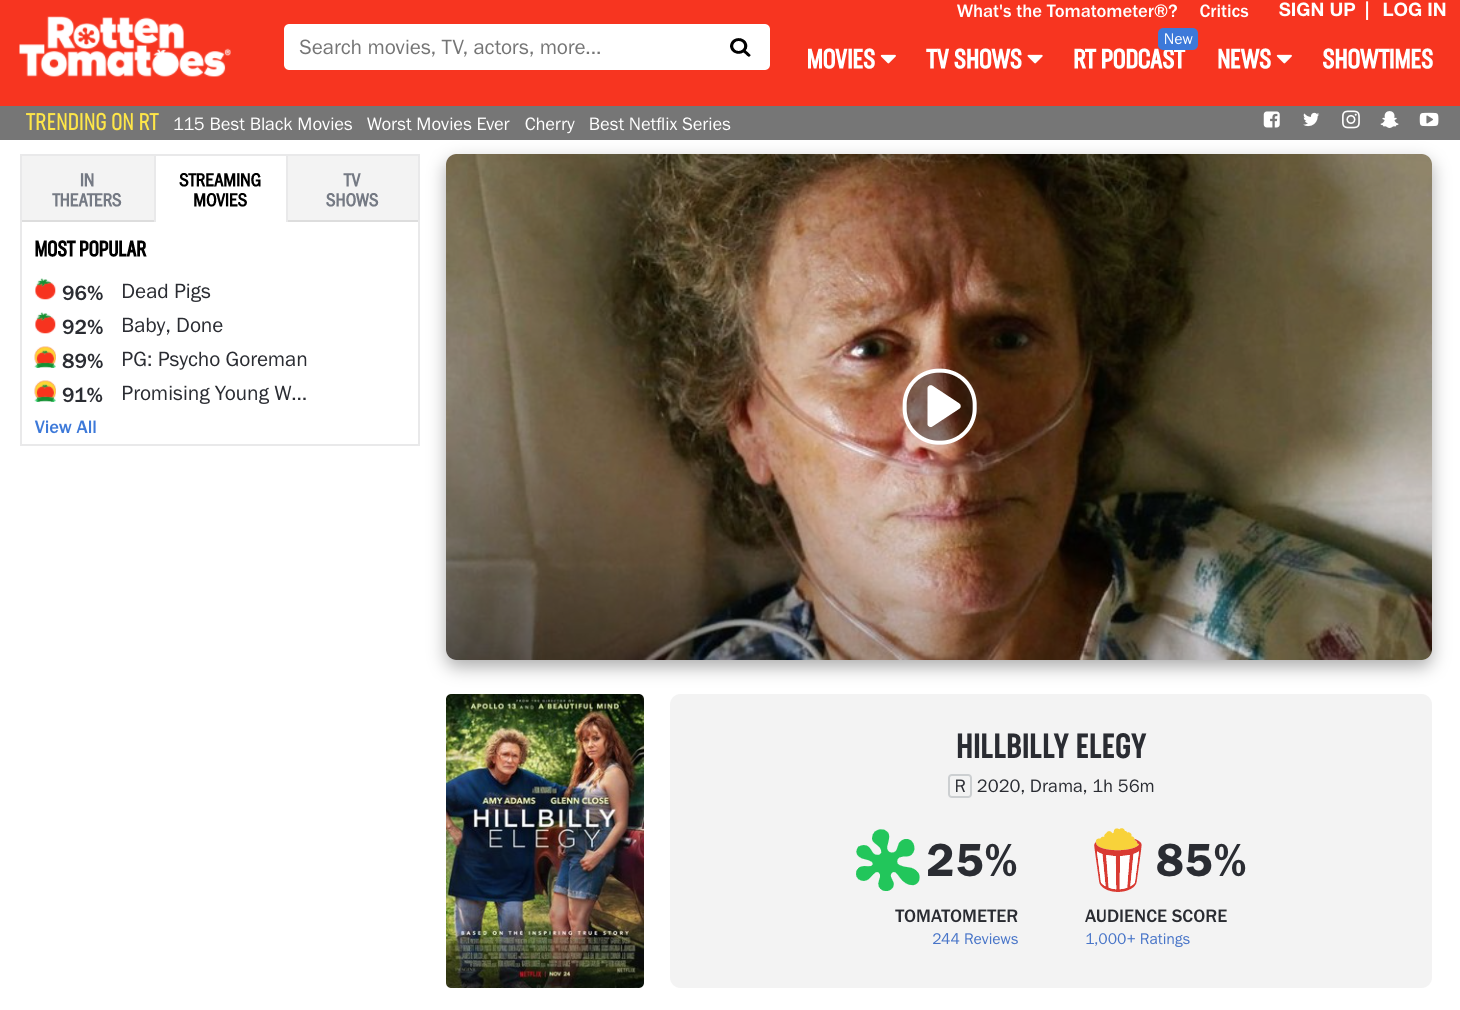 In other words, general audience members on average rated Hillbilly Elegy about 60 percentage points higher than critics… quite a difference in opinion. Taking a cursory glance at Top Critic reviews suggests something a through line that unifies Top Critic feedback: an aversion to not only artistic sensibilities but to the film’s political undertones:

Hillbilly Elegey Top Critic Reviews
Seeing this discrepancy brought to mind both: (1) other RT titles where Critics and Audience members held strongly opposed views — see Star Wars: The Last Jedi where Critics rated the film at 90% to the Audience’s 42% — and (2) growing evidence of media consumption differences as a part of larger political/cultural polarization trends.
With all of this background in mind, I assembled a dataset to help answer the following questions:
- Do Rotten Tomatoes Reviews evidence systematic film-taste differences between cultural elites (e.g. Critics Audience Reviews) and general audiences (e.g. Audience Reviews)?
- Are taste differences growing over time? If so, in which direction?
- What are the box office implications of producing films which divide Critics and Audience members?
In later versions of the page, I will spell out the details of the dataset creation. At a high level, all I did was: first, web-scrape Wikipedia for all American films made annually between 1920-2020; second web-scrape Rotten Tomatoes for Critic/Audience scores; and, third, web-scrape IMDb for information about the film (e.g. box office gross world wide and in the US, operating budget, director, etc). Web scraping was performed using R’s rvest library. All said and done, the final web-scraped/merged dataset has about a 8,900 movies across the past century (1920-2020) of American film.
Preliminary Results
Define score discrepancy, \(s_i\), as the difference between the Critic and Audience RT score for film \(i\). If \(s_i<0\; (s_i>0),\) this means that Audience (Critic) reviewers, on average, liked film \(i\) more than Critic (Audience) Reviewers.
The first chart depicts the distribution of \(s_i\) across all years in the data. I compute the share of films with score discrepancies that fall within 10-percent increments (e.g. films were Critics scored a film between 0 and 10 percentage points higher than Audience members account for 22.6% of films). Notice that the total number of films where \(|s_i|\leq10\%\) is about 40% of all movies and that Audience reviewers tend to rate movies slightly higher (e.g. \(s_i<0\) accounts for 52% of all films).
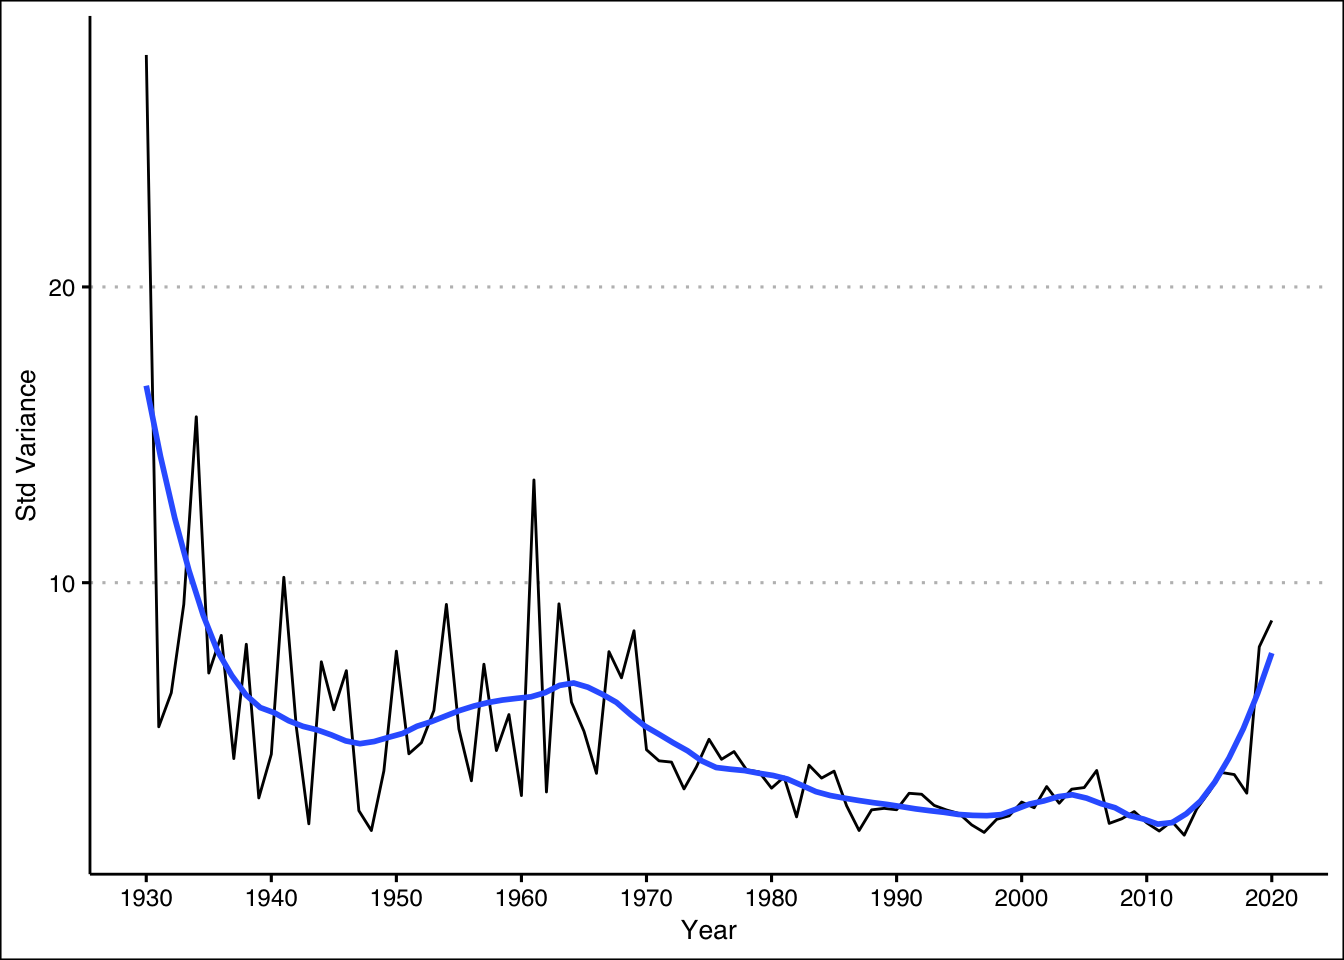
The second chart gives us our first look at time trends. I constructed this chart by computing the variance of \(s_i(t),\) that is all films from year \(t\), and then dividing said variance by the number of films that year thus “standardizing” the variance. Notice here that there is a downward trend/less score discrepancy variation up until about 2010.
The third chart plots the expected score difference for films in year \(t\). Up until the mid-1980’s, Critics tended to rate films higher than to Audience members. From the mid-1980’s to the about 2015, Audience members tended to rate films higher relative to Critics. Two important caveats here:
The dashed red line signifies the year (1998) that RT was launched as a website. Film scores before 1998 reflect contemporary audiences evaluating historical films whereas scores post 1998 reflect contemporary audiences evaluating contemporary films.
From about 2006 to 2018, the expected score difference went from roughly -17% to +5%. Put differently, expected film scores swing about 20 percentage points in little more than a decade. In historical context, the same kind of score jump took about three (3) decades to complete: expected score differences went from +5% in 1976 to -17% in 2006.
Simple Regression Results
This last section here attempts to tease out some kind of relationship between RT review scores and box office performance. In particular, I estimate the following model:
\[ \begin{aligned} G_{i,t}=&\beta_0+\beta_1 Budget_{i,t}+ \beta_2 Academy_{i,t}+\beta_3 Rating_{i,t}\\ +&\theta_t+\gamma_i+\varepsilon_{i,t} \end{aligned} \] where the dependent variable is \(G_{i,t}\) is the US box office real gross (mil 2020 USD) for film \(i\) made at time \(t\), and independent variables include: \(Budget_{i,t}\) is the film’s real (mil 2020 USD) budget, \(Academy_{i,t}\) is a dummy variable that codes for whether a film was nominated for an Academy Award, \(\theta_t\) and \(\gamma_i\) capture time and genre fixed effects, and \(Rating_{i,t}\) is the variable of interest. In Model (1), I use Critics’s review scores for \(Rating_{i,t},\) whereas I use Audience review scores and (pooled) IMBd scores for \(Rating_{i,t}\) in Model (2) and Model (3), respectively.
##
## ===============================================================
##                        Model 1       Model 2       Model 3
## ---------------------------------------------------------------
## budget_r                  0.886 ***     0.873 ***     0.843 ***
##                          (0.034)       (0.034)       (0.034)
## aca_nomYes               55.855 ***    50.586 ***    54.352 ***
##                          (6.401)       (6.250)       (6.369)
## AllCriticsScore           0.671 ***
##                          (0.054)
## AudienceScore                           1.290 ***
##                                        (0.078)
## imdb_score                                           19.786 ***
##                                                      (1.482)
## ---------------------------------------------------------------
## Num. obs.              2622          2609          2622
## R^2 (full model)          0.607         0.624         0.610
## R^2 (proj model)          0.311         0.344         0.318
## Adj. R^2 (full model)     0.547         0.568         0.552
## Adj. R^2 (proj model)     0.208         0.245         0.216
## ===============================================================
## *** p < 0.01, ** p < 0.05, * p < 0.1
Highlights from the preceding regression table include:
- RT scores are positively correlated with real US box office grosses.
- A one (1) point RT score increase from an Audience review is worth about 1.29 mil 2020 USD compared to 0.671 mil 2020 USD value for an analogous Critic score; thus, Audience scores are worth about 620k USD more than Critic Scores (in term of US box office gross).
- Audience score models have slightly higher explanatory power relative to Critic score models.
- The IMBd model serves as a nice robustness check for the RT models. Since IMBd scores range from 0-10 and RT scores range from 0-100, a quick conversion of units reveals that a one point increase in IMBd score is associated with a 1.98 mil increase in US box office gross.
David Terner
PhD Candidate
My research interests include international trade, maritime freight, applied microeconomics, and network microeconomics.